Are you actively monitoring your business's Key Performance Indicators (KPIs)? If not, now is the time to take action!
In the ever-evolving landscape of business, understanding and effectively monitoring Key Performance Indicators (KPIs) is vital for the success of an organization as they serve to guide decision-making and strategy formulation.
In this comprehensive guide, we'll delve into the intricacies of KPI tracking and monitoring, equipping you with the knowledge and tools necessary to optimize your business's performance.
Understanding Key Performance Indicators (KPIs)
So, what exactly are KPIs? In simple terms, Key Performance Indicators are those vital metrics that businesses rely on to measure progress towards their specific goals and objectives. They're the heartbeat of your company, revealing how well you're steering the ship towards success.

Dashboard to Track KPI Metrics
Imagine you're behind the wheel of a car. The dashboard of your car shows you important information like your speed, how much fuel you have left, and if your engine is running smoothly.

Similarly, KPIs are the specific measurements that show how well the business is doing. They can tell you if the business is moving in the right direction or if there are any problems that need attention.
Just like you glance at your car's dashboard to make sure everything is running smoothly while driving, a business owner or manager looks at KPIs to see if the business is on track and to make decisions on how to steer it in the right direction.
Why Track KPIs?
Tracking KPIs is crucial for several reasons:
- Measure Progress: KPIs provide a clear and quantifiable way to measure progress toward business goals. They help answer questions like "Are we on track?" and "How far have we come?"
- Identify Issues Early: By tracking KPIs regularly, businesses can quickly identify any issues or areas that are not performing as expected. This early detection allows for timely corrective action.
- Make Informed Decisions: KPIs provide data-driven insights, helping business leaders make informed decisions based on actual performance rather than guesswork.
- Focus on Priorities: With KPIs, organizations can focus their efforts on the areas that have the most significant impact on overall success. It helps in prioritizing resources and efforts.
- Drive Accountability: When teams and individuals have specific KPIs to track, it creates accountability. Everyone knows what they are responsible for and can see how their efforts contribute to the larger goals.
- Fine-Tune Performance: Continuous tracking of KPIs allows for ongoing optimization of processes, strategies, and activities. It helps in identifying what works well and what needs improvement.
- Goal Alignment: KPIs provide a common language for communicating progress within the organization. It helps in aligning everyone towards shared objectives.
In a nutshell, tracking KPIs isn't just about monitoring. It's about steering your business towards efficiency, agility, and that sweet spot of success.
Getting Started with KPI Tracking
Defining Business Goals
Before you can define Key Performance Indicators (KPIs), you need a clear understanding of your business objectives. These are the overarching goals that your company aims to achieve.
If you have no idea how to get started, here are the steps you may take as reference:
-
Gather Stakeholder Input: Talk to key stakeholders such as executives, managers, and department heads. Understand their perspectives on what the business needs to achieve.

- Review Mission and Vision Statements: Your company's mission and vision statements can provide valuable insight into its long-term goals. Use these as a foundation for defining objectives.
- Break Down Objectives: Large objectives can be daunting. Break them down into smaller, more manageable components. These smaller parts will form the basis for your KPIs.
Choosing the Right KPIs

When it comes to selecting the right Key Performance Indicators (KPIs) for your business, it's crucial to align them with your strategic objectives.
If the goal is to gain a financial advantage, the Financial Metrics category would be the primary area of focus. Metrics such as Revenue Growth, Profit Margins, Cash Flow, and ROI would be highly relevant.
If the focus is on enhancing customer satisfaction and driving growth, metrics under Customer Experience Metrics would be crucial. This includes metrics like Net Promoter Score (NPS), Customer Satisfaction Score (CSAT), Customer Retention Rate, and Repeat Purchase Rate.
To enhance social media presence and engagement, the Social Media Metrics category offers a wealth of metrics. This includes metrics such as Engagement Rate, Click-Through Rate (CTR), Follower Growth, Brand Mentions, and Influencer Engagement.
Here are some recommended metrics across various categories to consider based on the specific areas your business is targeting for growth:
Financial Metrics
- Revenue Growth: Year-over-year or quarter-over-quarter increase in total revenue.
- Profit Margins: Gross margin, operating margin, and net profit margin.
- Cash Flow: Operating cash flow, free cash flow, and cash conversion cycle.
- Return on Investment (ROI): Measure of the profitability of an investment.
- Customer Acquisition Cost (CAC): Cost associated with acquiring a new customer.
- Lifetime Value (LTV): Predicted revenue that a customer will generate over their lifetime.
- Break-even Point: The level of sales at which total revenues equal total costs.
- Working Capital: Current assets minus current liabilities, indicating short-term liquidity.
Sales and Marketing Metrics
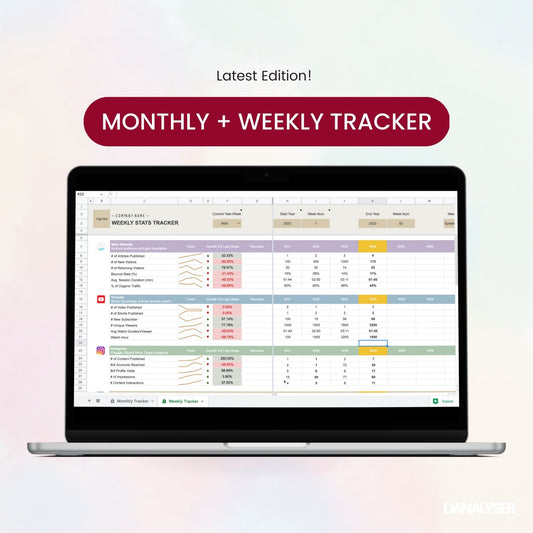
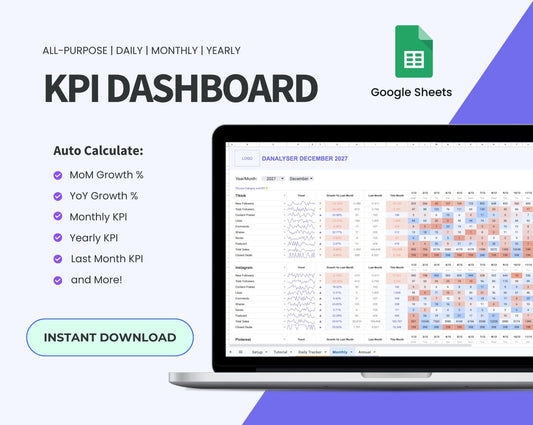
Danalyser's Social Media KPI Tracker Template (Available for Instant Download)- Lead Generation: Number of leads generated through various channels.
- Conversion Rates: Percentage of leads that convert into customers.
- Customer Retention Rate: Percentage of customers retained over a specific period.
- Average Order Value (AOV): Average amount spent by customers per transaction.
- Sales Pipeline Velocity: Rate at which opportunities move through the sales pipeline.
- Marketing Return on Investment (MROI): Measure of the revenue generated by marketing activities.
- Website Traffic: Number of visitors to your website and sources of traffic.
- Email Open and Click-through Rates: Engagement metrics for email marketing campaigns.
Operational and Efficiency Metrics
- Inventory Turnover: How quickly inventory is sold and replaced within a given period.
- Production Efficiency: Measure of how efficiently resources are used in production.
- Quality Control Metrics: Defect rates, customer complaints, and returns.
- Employee Productivity: Output per employee, sales per employee, etc.
- Supply Chain Metrics: On-time delivery, lead times, and supplier performance.
- Utilization Rates: Percentage of capacity or resources being used effectively.
- Downtime: Amount of time equipment or systems are not operational.
- Customer Service Metrics: Response time, resolution rate, and customer satisfaction scores.
Customer Experience Metrics
![]()
- Net Promoter Score (NPS): Measure of customer loyalty and satisfaction.
- Customer Satisfaction Score (CSAT): Direct feedback from customers on satisfaction.
- Customer Churn Rate: Percentage of customers who stop using your product or service.
- Customer Lifetime Value (CLV): Predicted revenue from a customer over their entire relationship with your business.
- Repeat Purchase Rate: Percentage of customers who make more than one purchase.
- Referral Rate: Number of new customers acquired through referrals from existing customers.
- Customer Complaints and Resolutions: Tracking complaints and how they are resolved.
- Social Media Engagement: Likes, shares, comments, and overall engagement on social platforms.
Employee Performance Metrics
- Employee Turnover Rate: Percentage of employees leaving the company within a given period.
- Employee Satisfaction: Surveys or feedback on job satisfaction and engagement.
- Training and Development Metrics: Hours of training per employee, certification rates.
- Absenteeism and Punctuality: Measures of attendance and punctuality.
- Employee Engagement Scores: Measures of how connected and committed employees are to the organization.
- Performance Reviews: Ratings and feedback from regular performance evaluations.
- Safety Metrics: Number of accidents, days without incidents, adherence to safety protocols.
- Leadership Development: Succession planning metrics, identification of future leaders.
Technology and Innovation Metrics

Website Analytics Dashboard
- Website/App Performance: Load times, uptime, and user experience metrics.
- Software Adoption Rate: Percentage of employees using new software or systems.
- Innovation Pipeline: Number of new ideas, patents, or prototypes in development.
- IT Costs and ROI: Cost of IT infrastructure and the return on investment.
- Cybersecurity Metrics: Number of security incidents, response times, and vulnerabilities.
- Digital Transformation Progress: Adoption of digital tools, processes, and technologies.
- Data Analytics Metrics: Usage of data analytics tools, insights generated, and data-driven decisions.
- R&D Spending: Investment in research and development activities.
Environmental and Social Responsibility Metrics
- Carbon Footprint: Measure of greenhouse gas emissions produced.
- Waste Reduction: Amount of waste generated and progress in reducing it.
- Community Impact: Contributions to local communities or charities.
- Diversity and Inclusion Metrics: Representation of diverse groups within the organization.
- Ethical Sourcing: Percentage of materials sourced ethically or sustainably.
- Employee Volunteering: Hours volunteered by employees or participation rates.
- Safety and Health Metrics: Workplace safety records, employee health initiatives.
- Public Perception: Surveys or ratings on corporate social responsibility efforts.
Set SMART KPIs
After you’ve chosen the KPI to track, you can now define the SMART Goals to drive your business success. The SMART criteria are a widely used framework for setting meaningful and actionable KPIs.

Here's how to apply each component:
- Specific: KPIs should be clear and precise, leaving no room for ambiguity. Instead of a vague goal like "Increase sales," a specific KPI would be "Increase monthly sales by 15%." or to be more specific, “Net Sales to increase by 15% MoM”.
- Measurable: KPIs must be quantifiable so you can track progress. This means attaching a numerical value or unit of measure to each KPI. For example, "Reduce customer complaints by 20%."
- Achievable: KPIs should be challenging yet realistic. Consider the resources, time, and capabilities available. Setting unattainable goals can lead to frustration and demotivation.
- Relevant: Ensure that each KPI directly contributes to your business objectives. They should align with your company's strategic priorities. For instance, if your objective is to expand into new markets, a relevant KPI could be "Increase market penetration by 10% in the next year."
- Time-bound: KPIs need a clear timeframe for achievement. This creates a sense of urgency and helps in monitoring progress. For example, "Reduce production costs by 5% by the end of the fiscal year."
KPI Tracking Tools and Softwares
In the digital age of business, the ability to effectively track and monitor Key Performance Indicators (KPIs) has been greatly enhanced by a wide array of tools and software solutions.
Here's a look at some popular options:
Excel Spreadsheets for Custom Tracking
Excel has long been the go-to tool for businesses to track and analyze data, including performance monitoring.
- Microsoft Excel: A versatile tool for creating customized KPI tracking spreadsheets, suitable for smaller businesses with simpler needs.
- Google Sheets: Offers collaborative and cloud-based spreadsheet solutions, accessible from anywhere with an internet connection.
- Airtable: A flexible and collaborative spreadsheet-database hybrid, allowing for custom KPI tracking with a variety of views and integrations.
For businesses facing the challenge of setting up a KPI tracking system quickly and efficiently, Excel templates present a powerful solution. By leveraging these templates, organizations can kickstart their KPI monitoring efforts with ease, focusing on deriving valuable insights and making data-driven decisions for growth and success.
Business Intelligence Tools for Real-Time Visibility

Amazon KPI Dashboard (Graphics by Author: Danalyser)
- Looker Studio (formerly known as Google Data Studio): Free tool for creating interactive dashboards, integrating seamlessly with Google's suite of products.
- Tableau: A powerful data visualization tool that allows you to create interactive and shareable dashboards.
- Microsoft Power BI: Offers robust analytics and visualization capabilities, integrating with various data sources for comprehensive insights.
Choosing the Right KPI Tracking System: Excel Spreadsheets vs. BI Dashboard Reporting
Excel Spreadsheets:
Advantages of Using Excel Templates for KPI Tracking:
- Time-Saving: Excel templates save businesses valuable time by eliminating the need to create KPI tracking spreadsheets from scratch. With pre-designed formats and formulas, users can simply input their data and begin analyzing results immediately. If you’re looking for spreadsheet solutions for KPIs tracking, here are some of the decent ones you can try. (ADD LINK)
- Customization: Templates are designed to be highly customizable, allowing businesses to tailor their KPI tracking sheets to specific objectives and metrics. Users can add or remove elements, adjust calculations, and personalize the layout to suit their needs.
- Ease of Use: These templates are user-friendly, even for those with limited Excel expertise. Clear instructions and guides are often provided to help users navigate the templates effectively, ensuring a smooth and hassle-free experience.
- Variety of Metrics: Excel templates cover diverse business metrics, from financial performance to operational efficiency, customer satisfaction, and more. This allows businesses to track multiple KPIs across different departments or functions within the organization.
- Cost-Effective Solution: Templates provide a cost-effective option for businesses of all sizes. They offer a professional and efficient way to track KPIs without the need for expensive software or complex systems.
Cons:
Static Reporting. However, Excel reports are often static and require manual updating. This can lead to delays in obtaining real-time insights and may be cumbersome for larger datasets.
BI Dashboard Tools
Dashboard reporting tools offer a modern and dynamic approach to KPI tracking. Here are the advantages they provide:
Advantage of using BI Dashboard Tools
- Real-Time Insights: Dashboards provide immediate, real-time insights into KPI performance. Data is updated automatically, ensuring that decision-makers always have the latest information at their fingertips.
- Interactive Visualizations: Dashboards present data in visually engaging formats such as charts, graphs, and gauges. This makes it easier to identify trends, patterns, and outliers at a glance.
- Reduced Human Error: BI tools like dashboard reporting solutions help minimize human error by reducing the likelihood of accidental edits to critical numbers. Since users typically interact with the data in a read-only format, there is less risk of unintentional changes to important metrics. This ensures data integrity and reliability, allowing decision-makers to trust the accuracy of the insights presented.
- Drill-Down Capabilities: Dashboard reporting tools often allow users to drill down into specific data points for deeper analysis. This feature enables users to identify the root causes behind trends or anomalies.
- Customizable Dashboards: Users can customize dashboards to display the most relevant KPIs for their business. This ensures that stakeholders focus on the metrics that matter most.
- Easy Access Sharing: Dashboards facilitate collaboration by allowing multiple users to access and interact with the same data in real time. Reports can be easily shared across teams and departments.
Whether you opt for spreadsheet solutions, or BI dashboard reporting tools, the key is to align these tools with your business objectives and choose the one that best fits your needs and budget.
In conclusion, while Excel remains a powerful tool for KPI tracking and analysis, dashboard reporting solutions offer a dynamic, real-time approach with interactive visualizations, automated insights, and the added benefit of centralized and error-reducing reporting.
Companies in search of immediate, actionable insights, streamlined collaboration, and trustworthy data accuracy may find dashboard reporting tools to be the ideal solution for their KPI monitoring needs.
Yet, for businesses aiming for quick KPI tracking, especially considering the technical familiarity of their audience, Excel could be the preferred choice.
Analyzing and Interpreting KPI Data
Analyzing Key Performance Indicator (KPI) data is a pivotal step in gaining valuable insights into your business's performance. Here are key strategies for effective analysis:
1. Identify Trends and Outliers
- Trends: Look for patterns over time in your KPI data. Are there consistent increases, decreases, or cyclical patterns? Trends can reveal underlying factors affecting performance.
- Outliers or Anomalies: Identify data points that significantly deviate from the norm. These anomalies may signal unexpected events, errors, or opportunities worth investigating.
2. Benchmarking
Compare your KPI data against benchmarks or industry standards. This provides context and helps evaluate how your business is performing relative to competitors or established norms.
3. Segment Data for Insights
Break down your KPI data into segments such as regions, product lines, customer segments, or time periods. This segmentation allows for a deeper understanding of specific areas of strength or weakness.
4. Data Visualizations

Monthly Analytics Report by Danalyser
Use charts, graphs, and other visual tools to represent your KPI data. Visualizations make it easier to spot trends, outliers, and patterns at a glance. They can simplify complex information and aid in decision-making.
By focusing on these core strategies—identifying trends and outliers, benchmarking, segmenting data, and utilizing data visualizations—you can extract meaningful insights from your KPI data. These insights, in turn, empower informed decision-making and drive strategic actions to improve business performance.
Conclusion
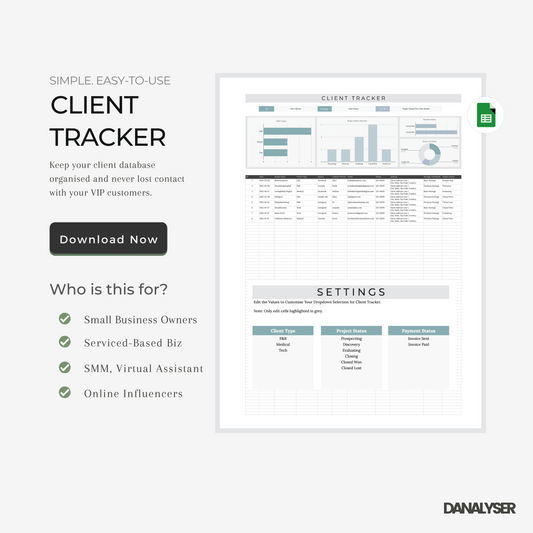
In the game of business, KPI tracking isn't a luxury—it's a necessity. So, roll up those sleeves, and get your KPI tracked today. If you need help, remember that Danalyser offers a few KPI Tracker Templates that you can put into good use right away!
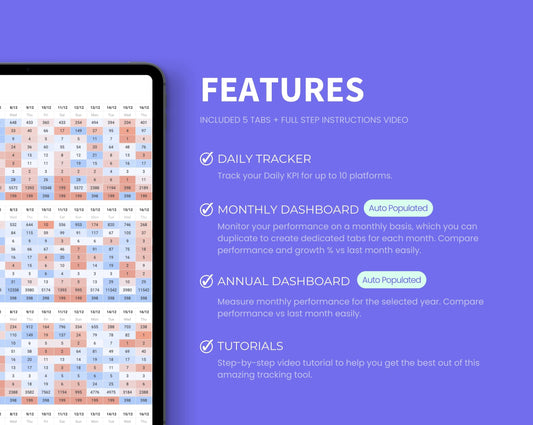
KPI Dashboard Tracker (Download Now)
Find this template in Danalyser's Store to start tracking your data!
FAQ Section
1. Why are KPIs important for business success?
KPIs provide quantifiable measures of performance, allowing businesses to track progress, identify areas for improvement, and make data-driven decisions to drive success.
2. How do I choose the right KPIs for my business?
Select KPIs that align with your specific business objectives and priorities, ensuring they are specific, measurable, and relevant to your goals.
3. What are some common challenges in KPI tracking?
Common challenges include defining meaningful KPIs, collecting accurate and reliable data, and interpreting insights effectively to drive actionable outcomes.
4. Can I use KPI tracking spreadsheets for different departments within my organization?
Absolutely! KPI tracking spreadsheets can be customized to suit the unique needs of various departments, providing a centralized platform for performance monitoring and analysis.
5. How often should I review and update my KPI tracking system?
Regular review and updates are essential to ensure the relevance and accuracy of your KPI tracking system. Aim for regular intervals, such as monthly or quarterly, to assess progress and make adjustments as needed.


