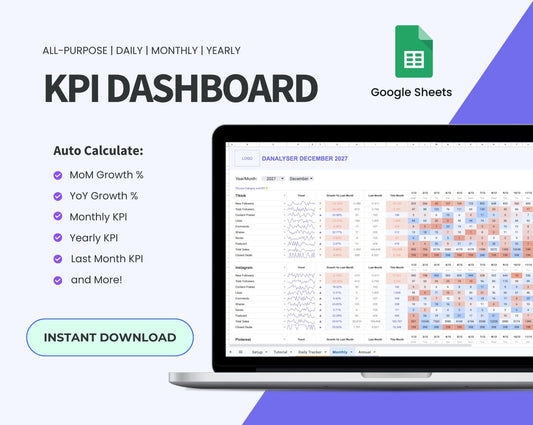
For social media managers, influencers, and business owners, understanding your follower growth is crucial. It helps you see if your audience is connecting with your content. While the best template for tracking followers is the "Social Media Tracker," which offers unlimited metrics and platform support, some of you may still prefer the "Ultimate KPI Dashboard" for its ability to compare yearly data.
In this tutorial, I'll walk you through editing and modifying the formulas to track the number of followers on your social media accounts.
Video Tutorial Available
If you prefer visual instructions, we also have video tutorials available on our website. These videos provide step-by-step guidance on using the Danalyser Ultimate KPI Dashboard to track your social media followers effectively.
Click to Watch for Free on Youtube
Step 1: Make a Backup Copy
First thing first, to make sure that you have the original copy safe. Kindly make a copy of the current template and save it to your Google drive.
Steps to Backup Template

Open your Danalyser Ultimate KPI Dashboard in Google Sheets. Go to File. Select Make a Copy.
Step 2: Add Platforms and Followers Count
Now, navigate to Setup tab to add the social media platforms and the metric name for total followers count.
To add the social media platforms, enter the platform name under Category dropdown menu.

You can enter up to 20 social media platforms.
Next, enter the metric name "Total Followers" under KPI name table.

Step 3: Track Daily Followers Count
Now, navigate to Daily Tracker tab to start tracking the daily followers count.
- Date: Double click the cell to insert a date. Or simply type the date into the cell.
- Platform: Select the platform using the dropdown. Here you will see all the 20 options you have setup in Step 2. Let's say you select "Facebook".
- Total Followers: Here you'll see the metric you setup in Step 2 updated automatically on the header. Now, enter the number of followers on the day for "Facebook".
- Repeat the same steps every day.

Step 4: Monthly Dashboard, Yearly Dashboard Setup
Now, navigate to Monthly tab. Make a copy of the Monthly tab.
Then, select the platform and metric from the dropdown.
For example: Platform: Facebook. Metric: Total Followers.

As soon as the platform and metric is chosen, the total followers for the month will be populated automatically, with an aesthetic line chart to help you visualise the daily trend.
The growth vs last month is also calculated automatically, as long as you have data entered from last month.
Change Year/Month
There is a dropdown for year and month for you to customise the Monthly dashboard. Choose your desired timeframe for your reporting need. Once selected, the entire dashboard would be updated.
Step 5: Modifying the Formula (Monthly Dashboard)
Now the tricky part is that this template is always summing up the metrics, which I believe is the feature I would continuously improve on in the future, to support max and average aggregation method.
Meanwhile, I have found a solution and I would love to share with you so you can make the best out of this product.
For the monthly reporting, we always want to get the last date's total followers.
To do that, we remove the formula in the same row as the metric "Total Followers" - only for the column J (Column Name: This Month)
Original Formula: =IF(SUM(K10:AO10)=0,"",SUM(K10:AO10))
Modified Formula:
=INDIRECT(ADDRESS(row(),MAX(FILTER(COLUMN(INDIRECT("K" & ROW() & ":AO" & ROW())), LEN(INDIRECT("K" & ROW() & ":AO" & ROW())) > 0))))
Enter the above formula to the This Month, for the rows you selected as "Total Followers".
This formula will get you the maximum date's followers count for the month.
Step 6: Modify Yearly Dashboard
This Year Total Followers Count
Copy and paste the following formula to the cell J (This Year), only for the rows you tracked for Total followers.
Formula:
=INDIRECT(ADDRESS(row(),MAX(FILTER(COLUMN(INDIRECT("K" & ROW() & ":V" & ROW())), INDIRECT("K" & ROW() & ":V" & ROW()) > 0))))
Monthly Total Followers Count
Copy and paste the following formula to the cell K (This Year), only for the rows you tracked for Total followers. Then drag to the right to copy the formula to every other months.

Formula:
=IFERROR(QUERY('Daily Tracker'!$A$6:D, "SELECT D WHERE B >= date '"&TEXT(DATE(YEAR(K$8), MONTH(K$8), 1), "yyyy-mm-dd")&"' AND B <= date '"&TEXT(EOMONTH(K$8, 0), "yyyy-mm-dd")&"' ORDER BY B DESC LIMIT 1"),"")
Step 7: Enter Last Period's Total Followers Count Manually
Now, you may noticed the last month's followers count and last year's followers count is not displaying the correct figures.
You can replace the formula with the exact number of followers at the time.
Alternatively, use two monthly tabs, one for the current month and one for the last, and refer to the previous month's followers. This ensures you always have the correct followers growth rate without manual updates.
Same applies for annual dashboard.
This is explained in detail in the Youtube tutorial, you may click the link below to watch.
Click to Watch for Free on Youtube
Additional Resources
If you prefer visual instructions, we also have video tutorials available on our website. These videos provide step-by-step guidance on using the Danalyser Ultimate KPI Dashboard to track your social media followers effectively.
- Get Started with Danalyser Ultimate KPI Dashboard 1.0
- How to Calculate Ratio with Ultimate KPI Dashboard
- How to Change the Conditional Color for Positive and Negative Trend
Feedback are welcome!
We are always improvising our template, to give you the best experience. Please do not hesitate to reach out should you have any questions or suggestions for us. Thank you so much!